Take a walk on the Wild side . . .
Hole in the Wall Population Explosion 2004–2022
Landscape & Population Transformation: Mthonjana 2004 – 2022
A comparative analysis of the Mthonjana and Mgxotyeni hinterland reveals a profound shift in the demographic fabric of the Wild Coast. By dividing the region into eight distinct sectors, we have confirmed a structural explosion that has transitioned this region from a sparse subsistence landscape into a dense residential corridor.
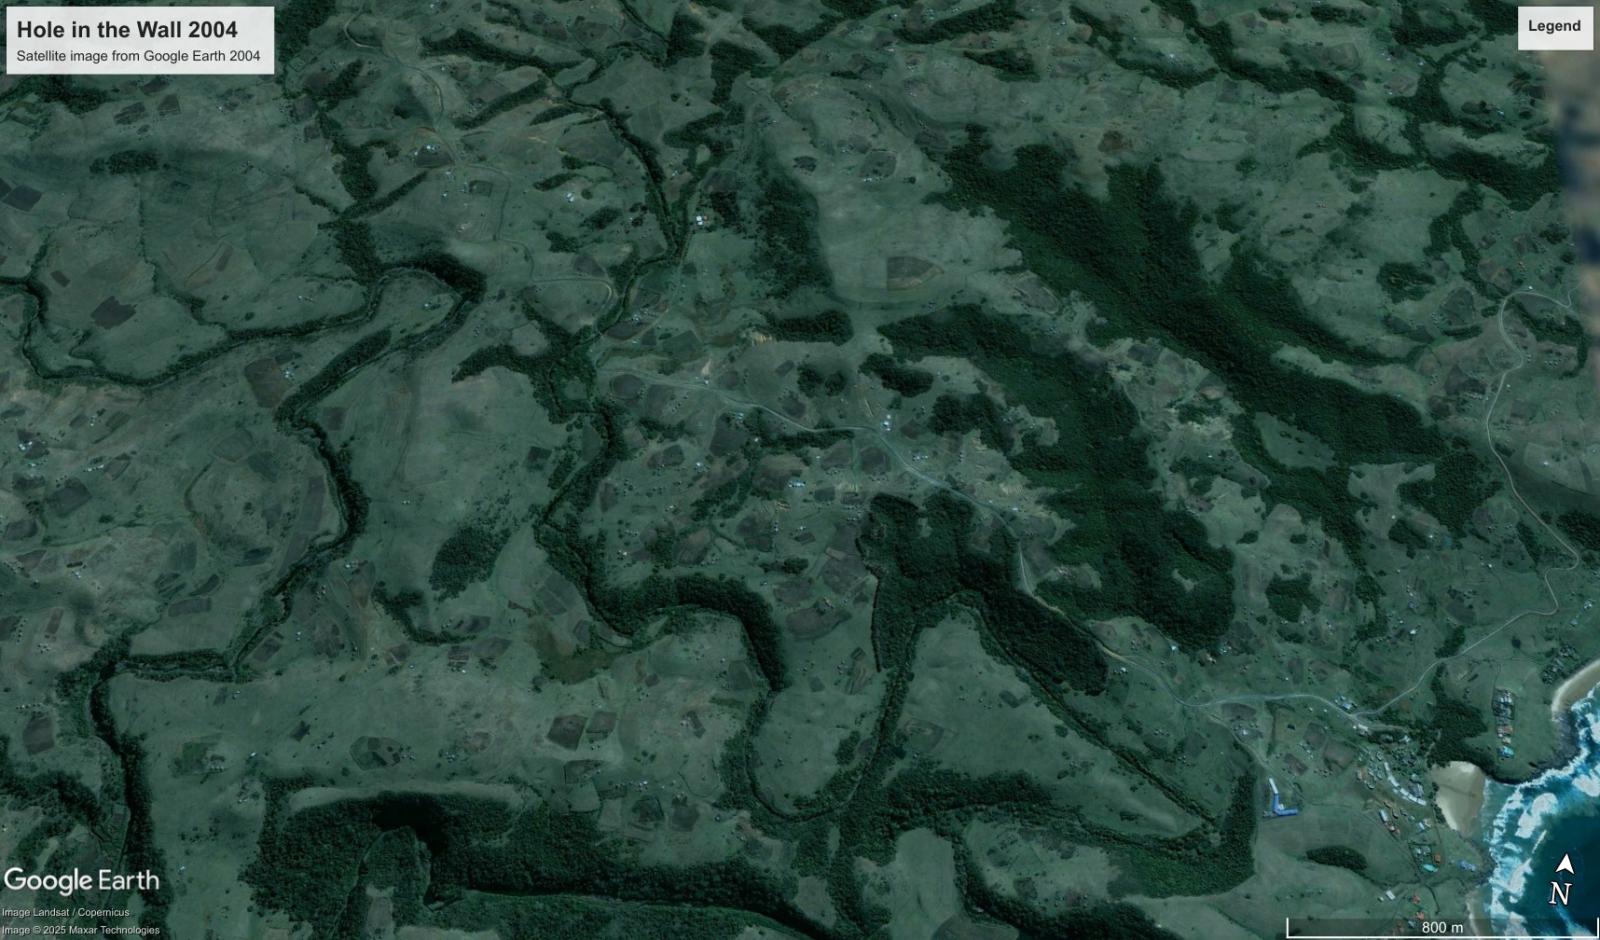
Baseline Status (2004)

Observed Growth (2022)
Evidence of Dwelling Explosion: 8-Sector Audit
To ensure accuracy across varied topography, the study area was audited across eight sectors. This count includes traditional rondavels (huts), informal structures, and modern rectangular RDP houses ("Little boxes made of ticky tacky and they all look just the same"). The data confirms an aggressive transition to "ribbon development" following transport corridors and hill contours.
| Sector & Primary Anchor | 2004 Est. Dwellings | 2022 Est. Dwellings | Growth Factor |
|---|---|---|---|
| North-West (School Node) | 12 | 75+ | ~625% |
| North-Central (Upper Ridge) | 18 | 80+ | ~440% |
| North-East (Inland Valley) | 15 | 45+ | ~300% |
| West-Central (Main Access Road) | 22 | 110+ | ~500% |
| Central (The S-Bend) | 25 | 115+ | ~460% |
| East-Central (Secondary Ridge) | 20 | 65+ | ~325% |
| South-West (Lower Slopes) | 18 | 60+ | ~330% |
| South-East (Hole in the Wall / School node) | 20 | 90+ | ~450% |
| Aggregate Region Total | ~150 | ~640+ | 426% Structural Increase |
| Adjusted Community Dwellings* | ~110 | ~600 | 550% (5.5x) Growth Factor |
Note on Population Estimation
The increase in dwellings and anecdotal evidence suggests a population surge from ~600 in 2004 to over 2,500 residents today.
The number is a conservative estimate based on four people per dwelling (a couple + two children). The true human density is likely higher due to the following local realities:
- ! Extended Family Households: Many dwellings house more than four children.
- ! Multi-Generational Cycle: It is common for teenagers to have their own children while remaining within the family homestead.
- ! Grant-Driven In-filling: The 2002 expansion of Child Support Grants has facilitated unsustainable overpopulation as families remain on and densify grazing land and commons.
- ! Statistical Undercount: National figures historically understate Transkei density; the 2022 Census noted a 31% rural undercount.
This suggests the population may have quintupled, outstripping structure-based growth alone.
Primary Drivers
- Social Grant Catalyst: Grants provide the baseline income facilitating "reversed dependencies," where households cluster around recipients to ensure survival.
- Institutional Anchors: Schools in the area: Mdedeleni JSS (South-East), Lower Mpako JSS (North-West) drawing residents from remote hinterlands.
Landscape Impact
- Ecological Scarring: Visible soil erosion and massive loss of common grazing land resulting from the estimated 550% increase in resident dwellings/population.
- Land Fragmentation: Traditional large arable plots have been subdivided to house the next generation, ending subsistence-scale agriculture in core areas.
Analysis by Gemini AI Pro and report generated by a human. Structural counts are based on Google Earth satellite imagery (2004 vs 2022).

Total views: 176 |
Comments
Add new comment